
Page 185 - Emerging Trends and Innovations in Web-Based Applications and Technologies
P. 185
International Journal of Trend in Scientific Research and Development (IJTSRD) @ www.ijtsrd.com eISSN: 2456-6470
Precision= True Positives F1-Score= 2×Precision×Recall
True Positives + False Positives Precision + Recall
Recall: By utilizing these metrics, Quick Mart can ensure that the
Recall measures how often the classifier identifies positive CNN model is classifying second-hand products accurately
instances from all actual positive instances. It is calculated and efficiently. These evaluations also help in continuously
as: refining the model, addressing any classification errors, and
ultimately improving the user experience in the marketplace.
Recall= True Positives Through ongoing monitoring and adjustment, the system will
True Positives + False Negatives
become even more robust, driving the success of Quick
2. F1 Score: Mart’s reimagined second-hand commerce platform.
The F1 score is the harmonic mean of precision and recall,
providing a balanced measure of the classifier's performance.
It is calculated as:
VI. RESULT ANALYSIS
The experiments were conducted using a computer equipped with an Intel Core i5 CPU and 4GB of RAM, with Jupyter Notebook
facilitating the development and training of the smart solutions designed for Quick Mart’s second-hand marketplace. The
experimental results show a substantial improvement in the marketplace's operational efficiency, achieving an accuracy of
92.14% for the proposed solution. This system effectively identifies and categorizes items, enhancing the second-hand trading
process by providing accurate product classifications.
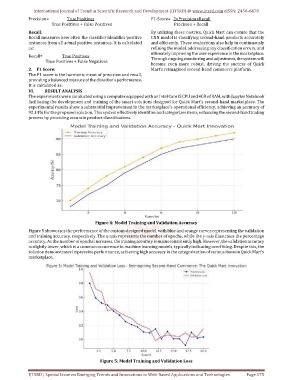
Figure 4: Model Training and Validation Accuracy
Figure 5 showcases the performance of the custom-designed model, with blue and orange curves representing the validation
and training accuracy, respectively. The x-axis represents the number of epochs, while the y-axis illustrates the percentage
accuracy. As the number of epochs increases, the training accuracy remains consistently high. However, the validation accuracy
is slightly lower, which is a common occurrence in machine learning models, typically indicating overfitting. Despite this, the
solution demonstrates impressive performance, achieving high accuracy in the categorization of various items in Quick Mart's
marketplace.
Figure 5: Model Training and Validation Loss
IJTSRD | Special Issue on Emerging Trends and Innovations in Web-Based Applications and Technologies Page 175