
Page 178 - Emerging Trends and Innovations in Web-Based Applications and Technologies
P. 178
International Journal of Trend in Scientific Research and Development (IJTSRD) @ www.ijtsrd.com eISSN: 2456-6470
category. This layer enables the model to classify labels as positive. This metric is crucial for minimizing false
products into specific categories with high confidence. positives, which can undermine user trust. Precision is
calculated using the formula:
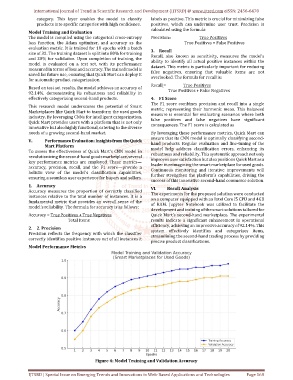
Model Training and Evaluation
The model is compiled using the categorical cross-entropy Precision= True Positives
loss function, the Adam optimizer, and accuracy as the True Positives + False Positives
evaluation metric. It is trained for 10 epochs with a batch
3. Recall
size of 32. The training dataset is split into 80% for training
Recall, also known as sensitivity, measures the model’s
and 20% for validation. Upon completion of training, the
ability to identify all actual positive instances within the
model is evaluated on a test set, with its performance
dataset. This metric is particularly important for reducing
measured in terms of loss and accuracy. The trained model is
false negatives, ensuring that valuable items are not
saved for future use, ensuring that Quick Mart can deploy it
overlooked. The formula for recall is:
for automatic product categorization.
Recall = True Positives
Based on test set results, the model achieves an accuracy of
92.14%, demonstrating its robustness and reliability in True Positives + False Negatives
effectively categorizing second-hand products. 4. F1 Score
The F1 score combines precision and recall into a single
This research model underscores the potential of Smart metric, representing their harmonic mean. This balanced
Marketplaces like Quick Mart to transform the used goods measure is essential for evaluating scenarios where both
industry. By leveraging CNNs for intelligent categorization, false positives and false negatives have significant
Quick Mart provides users with a platform that is not only consequences. The F1 score is calculated as
innovative but also highly functional, catering to the diverse
needs of a growing second-hand market. By leveraging these performance metrics, Quick Mart can
V. Performance Evaluation: Insights from the Quick ensure that its CNN model is optimally classifying second-
hand products. Regular evaluation and fine-tuning of the
Mart Platform
model help address classification errors, enhancing its
To assess the effectiveness of Quick Mart’s CNN model in
robustness and reliability. This systematic approach not only
revolutionizing the second-hand goods marketplace, several improves user satisfaction but also positions Quick Mart as a
key performance metrics are employed. These metrics— leader in reimagining the smart marketplace for used goods.
accuracy, precision, recall, and the F1 score—provide a Continuous monitoring and iterative improvements will
holistic view of the model’s classification capabilities, further strengthen the platform’s capabilities, driving the
ensuring a seamless user experience for buyers and sellers.
success of this innovative second-hand commerce solution.
1. Accuracy VI.
Accuracy measures the proportion of correctly classified Result Analysis
The experiments for the proposed solution were conducted
instances relative to the total number of instances. It is a
on a computer equipped with an Intel Core i5 CPU and 4GB
fundamental metric that provides an overall sense of the
of RAM. Jupyter Notebook was utilized to facilitate the
model’s reliability. The formula for accuracy is as follows:
development and training of the smart solutions tailored for
Accuracy = True Positives + True Negatives Quick Mart’s second-hand marketplace. The experimental
Total Items results indicate a significant enhancement in operational
efficiency, achieving an impressive accuracy of 92.14%. This
2. 2. Precision system effectively identifies and categorizes items,
Precision reflects the frequency with which the classifier streamlining the second-hand trading process by providing
correctly identifies positive instances out of all instances it
precise product classifications.
Model Performance Metrics
Figure 4: Model Training and Validation Accuracy
IJTSRD | Special Issue on Emerging Trends and Innovations in Web-Based Applications and Technologies Page 168