
Page 696 - Emerging Trends and Innovations in Web-Based Applications and Technologies
P. 696
International Journal of Trend in Scientific Research and Development (IJTSRD) @ www.ijtsrd.com eISSN: 2456-6470
V. PERFORMANCE EVALUATION
Performance evaluation is a critical step in assessing the effectiveness of the Fake Logo Detection System. This phase measures
how well the model can correctly classify logos as genuine or counterfeit using various evaluation metrics. The evaluation
provides insights into the system's strengths, weaknesses, and overall reliability in real-world applications.
Evaluation Metrics
Accuracy is the primary metric, representing the percentage of correctly classified logos in the test set. However, for a more
comprehensive evaluation, precision and recall are also used. Precision measures how many predicted counterfeit logos are
actually fake, while recall indicates how many actual counterfeit logos were correctly detected. The F1-score, which combines
precision and recall, offers a balanced measure of the model’s performance, particularly in cases of class imbalance. A
confusion matrix further helps to visualize the model's classification errors by showing true positives, true negatives, false
positives, and false negatives.
Cross-Validation
Cross-validation ensures the model generalizes well by evaluating it on different subsets of the data. K-fold cross-validation
helps reduce overfitting, ensuring that the model performs well on unseen data.
Comparison with Baseline Models
To assess the model's superiority, its performance is compared with baseline models, such as Support Vector Machines (SVM)
and shallow neural networks. This comparison highlights the advantages of the CNN-based approach for detecting complex
logo patterns.
Real-World Testing
Finally, real-world testing is conducted with logos not seen during training to evaluate the model’s performance in practical
scenarios. This testing ensures the system works effectively across different industries and logo variations.
VI. RESULT ANALYSIS
Result analysis is an essential part of the evaluation process, as it helps determine how well the Fake Logo Detection System
performs in real-world scenarios. This phase involves analyzing the model's predictions, comparing them with ground truth
data, and identifying areas of improvement. The goal is to gain insights into the model's accuracy, robustness, and its ability to
generalize to new, unseen data.
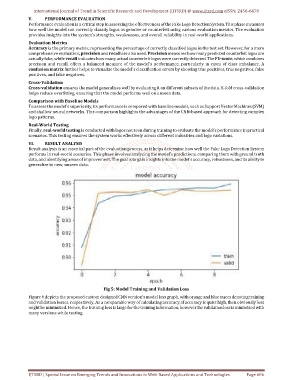
Fig 5: Model Training and Validation Loss
Figure 6 depicts the proposed custom designed CNN version's model loss graph, with orange and blue traces denoting training
and validation losses, respectively. As a comparable way of calculating accuracy, if accuracy is quiet high, then obviously loss
might be minimized. Hence, the training loss is large for the training information, however the validation loss is minimized with
many versions while testing.
IJTSRD | Special Issue on Emerging Trends and Innovations in Web-Based Applications and Technologies Page 686