
Page 777 - Emerging Trends and Innovations in Web-Based Applications and Technologies
P. 777
International Journal of Trend in Scientific Research and Development (IJTSRD) @ www.ijtsrd.com eISSN: 2456-6470
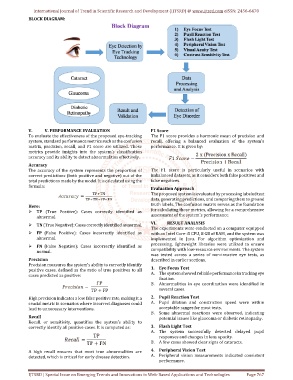
BLOCK DIAGRAM:
V. V. PERFORMANCE EVALUATION F1 Score
To evaluate the effectiveness of the proposed eye-tracking The F1 score provides a harmonic mean of precision and
system, standard performance metrics such as the confusion recall, offering a balanced evaluation of the system's
matrix, precision, recall, and F1 score are utilized. These performance. It is given by:
metrics provide insights into the system's classification
accuracy and its ability to detect abnormalities effectively.
Accuracy
The accuracy of the system represents the proportion of The F1 score is particularly useful in scenarios with
correct predictions (both positive and negative) out of the imbalanced datasets, as it considers both false positives and
total predictions made by the model. It is calculated using the false negatives.
formula:
Evaluation Approach
The proposed system is evaluated by processing labeled test
data, generating predictions, and comparing them to ground
truth labels. The confusion matrix serves as the foundation
Here:
for calculating these metrics, allowing for a comprehensive
TP (True Positive): Cases correctly identified as
assessment of the system's performance.
abnormal.
VI. RESULT ANALYSIS
TN (True Negative): Cases correctly identified as normal.
The experiments were conducted on a computer equipped
FP (False Positive): Cases incorrectly identified as with an Intel Core-i5 CPU, 8 GB of RAM, and the system was
abnormal. implemented in Java. For algorithm optimization and
processing, lightweight libraries were utilized to ensure
FN (False Negative): Cases incorrectly identified as
compatibility with low-resource environments. The system
normal.
was tested across a series of non-invasive eye tests, as
Precision described in earlier sections.
Precision measures the system's ability to correctly identify
positive cases, defined as the ratio of true positives to all 1. Eye Focus Test
cases predicted as positive: A. The system showed reliable performance in tracking eye
fixation.
B. Abnormalities in eye coordination were identified in
several cases.
High precision indicates a low false positive rate, making it a 2. Pupil Reaction Test
crucial metric in scenarios where incorrect diagnoses could A. Pupil dilation and constriction speed were within
lead to unnecessary interventions. acceptable ranges for most tests.
B. Some abnormal reactions were observed, indicating
Recall potential issues like glaucoma or diabetic retinopathy.
Recall, or sensitivity, quantifies the system’s ability to
correctly identify all positive cases. It is computed as: 3. Flash Light Test
A. The system successfully detected delayed pupil
responses and changes in lens opacity.
B. A few cases showed clear signs of cataracts.
A high recall ensures that most true abnormalities are 4. Peripheral Vision Test
detected, which is critical for early disease detection. A. Peripheral vision measurements indicated consistent
performance.
IJTSRD | Special Issue on Emerging Trends and Innovations in Web-Based Applications and Technologies Page 767