
Page 59 - Emerging Trends and Innovations in Web-Based Applications and Technologies
P. 59
International Journal of Trend in Scientific Research and Development (IJTSRD) @ www.ijtsrd.com eISSN: 2456-6470
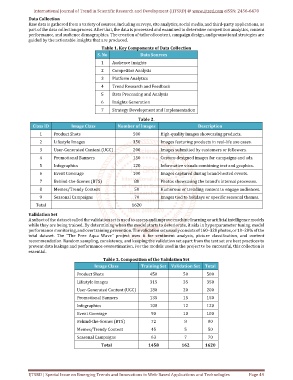
Data Collection
Raw data is gathered from a variety of sources, including surveys, site analytics, social media, and third-party applications, as
part of the data collection process. After that, the data is processed and examined to determine competition analytics, content
performance, and audience demographics. The creation of tailored content, campaign design, and promotional strategies are
guided by the actionable insights that are produced.
Table 1. Key Components of Data Collection
S. No Data Sources
1 Audience Insights
2 Competitor Analysis
3 Platform Analytics
4 Trend Research and Feedback
5 Data Processing and Analysis
6 Insights Generation
7 Strategy Development and Implementation
Table 2.
Class ID Image Class Number of Images Description
1 Product Shots 500 High-quality images showcasing products.
2 Lifestyle Images 350 Images featuring products in real-life use cases.
3 User-Generated Content (UGC) 200 Images submitted by customers or followers.
4 Promotional Banners 150 Custom-designed images for campaigns and ads.
5 Infographics 120 Informative visuals combining text and graphics.
6 Event Coverage 100 Images captured during brand-hosted events.
7 Behind-the-Scenes (BTS) 80 Photos showcasing the brand’s internal processes.
8 Memes/Trendy Content 50 Humorous or trending content to engage audiences.
9 Seasonal Campaigns 70 Images tied to holidays or specific seasonal themes.
Total 1620
Validation Set
A subset of the dataset called the validation set is used to assess and improve machine learning or artificial intelligence models
while they are being trained. By determining when the model starts to deteriorate, it aids in hyperparameter tuning, model
performance monitoring, and overtraining prevention. The validation set usually consists of 160–320 photos, or 10–20% of the
total dataset. The "The Free Aqua Wave" project uses it for sentiment analysis, picture classification, and content
recommendation. Random sampling, consistency, and keeping the validation set apart from the test set are best practices to
prevent data leakage and performance overestimation. For the models used in the project to be successful, this collection is
essential.
Table 3. Composition of the Validation Set
Image Class Training Set Validation Set Total
Product Shots 450 50 500
Lifestyle Images 315 35 350
User-Generated Content (UGC) 180 20 200
Promotional Banners 135 15 150
Infographics 108 12 120
Event Coverage 90 10 100
Behind-the-Scenes (BTS) 72 8 80
Memes/Trendy Content 45 5 50
Seasonal Campaigns 63 7 70
Total 1458 162 1620
IJTSRD | Special Issue on Emerging Trends and Innovations in Web-Based Applications and Technologies Page 49