
Page 706 - Emerging Trends and Innovations in Web-Based Applications and Technologies
P. 706
International Journal of Trend in Scientific Research and Development (IJTSRD) @ www.ijtsrd.com eISSN: 2456-6470
Accuracy:
The proportion of correctly classified instances (both true positives and true negatives) out of the total instances. While
accuracy provides a general measure of model performance, it may not fully capture effectiveness in cases of imbalanced class
distributions.
Precision:
The ratio of true positives (correctly identified fake news articles) to the total predicted positives (articles flagged as fake). High
precision indicates a low false positive rate, which is crucial in scenarios where false alarms can be costly.
Recall:
The ratio of true positives to the total actual positives (all actual fake news articles). High recall ensures that most fake news
articles are identified, minimizing the risk of overlooking false information.
F1 Score:
The harmonic means of precision and recall, providing a balanced measure between the two metrics. Particularly useful in fake
news detection as it addresses the trade-off between precision and recall, ensuring neither false positives nor false negatives
dominate evaluation.
Analyze misclassifications to identify patterns or common characteristics among incorrectly classified articles. For instance, if a
model consistently misclassifies certain types of articles (e.g., product-related news), this may indicate a need for targeted
improvements in feature extraction or model training.
Recent Findings:
Recent studies have highlighted significant results in evaluating fake news detection models:
For example, a BERT-based model achieved an F1 score of approximately 95.48%, outperforming other models like XLNet and
GPT-2.
Another study reported that stacking classifiers can improve accuracy significantly, with some models achieving up to 99.94%
accuracy on specific datasets.
VI. RESULT ANALYSIS
The result analysis of various fake news detection models highlights their performance based on several metrics,
methodologies, and findings from recent studies. Below is a summary of the key results and insights derived from the provided
search results.
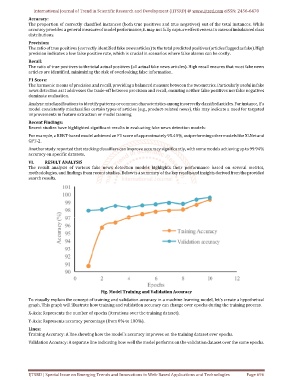
Fig. Model Training and Validation Accuracy
To visually explain the concept of training and validation accuracy in a machine learning model, let's create a hypothetical
graph. This graph will illustrate how training and validation accuracy can change over epochs during the training process.
X-Axis: Represents the number of epochs (iterations over the training dataset).
Y-Axis: Represents accuracy percentage (from 0% to 100%).
Lines:
Training Accuracy: A line showing how the model's accuracy improves on the training dataset over epochs.
Validation Accuracy: A separate line indicating how well the model performs on the validation dataset over the same epochs.
IJTSRD | Special Issue on Emerging Trends and Innovations in Web-Based Applications and Technologies Page 696