
Page 707 - Emerging Trends and Innovations in Web-Based Applications and Technologies
P. 707
International Journal of Trend in Scientific Research and Development (IJTSRD) @ www.ijtsrd.com eISSN: 2456-6470
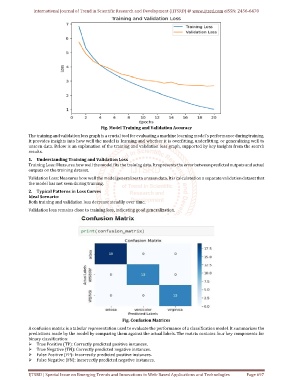
Fig. Model Training and Validation Accuracy
The training and validation loss graph is a crucial tool for evaluating a machine learning model's performance during training.
It provides insights into how well the model is learning and whether it is overfitting, underfitting, or generalizing well to
unseen data. Below is an explanation of the training and validation loss graph, supported by key insights from the search
results.
1. Understanding Training and Validation Loss
Training Loss: Measures how well the model fits the training data. It represents the error between predicted outputs and actual
outputs on the training dataset.
Validation Loss: Measures how well the model generalizes to unseen data. It is calculated on a separate validation dataset that
the model has not seen during training.
2. Typical Patterns in Loss Curves
Ideal Scenario:
Both training and validation loss decrease steadily over time.
Validation loss remains close to training loss, indicating good generalization.
Fig. Confusion Matrices
A confusion matrix is a tabular representation used to evaluate the performance of a classification model. It summarizes the
predictions made by the model by comparing them against the actual labels. The matrix contains four key components for
binary classification:
True Positive (TP): Correctly predicted positive instances.
True Negative (TN): Correctly predicted negative instances.
False Positive (FP): Incorrectly predicted positive instances.
False Negative (FN): Incorrectly predicted negative instances.
IJTSRD | Special Issue on Emerging Trends and Innovations in Web-Based Applications and Technologies Page 697