
Page 719 - Emerging Trends and Innovations in Web-Based Applications and Technologies
P. 719
International Journal of Trend in Scientific Research and Development (IJTSRD) @ www.ijtsrd.com eISSN: 2456-6470
online sources, including e-commerce sites and social media platforms, will also be examined to ensure that the web scraper
and AI model function effectively across diverse environments. Finally, the model’s scalability and efficiency will be tested to
determine how well it can handle large-scale logo datasets and rapid classification tasks, making it suitable for practical
implementation.
Evaluation Metrics
The primary metric for evaluating the model’s performance is accuracy, representing the percentage of correctly classified
logos. Precision and recall will also be used: precision measures how many predicted counterfeit logos are actually fake, while
recall indicates how many actual counterfeit logos are detected. The F1-score combines precision and recall, offering a balanced
measure, especially in imbalanced datasets. A confusion matrix will visualize true positives, true negatives, false positives, and
false negatives to help identify classification errors.
Cross-Validation
K-fold cross-validation will be used to assess the model’s generalization ability by evaluating it on different subsets of the data.
This technique helps prevent overfitting and ensures the model performs well on unseen data, providing a reliable estimate of
its real-world performance.
Comparison with Baseline Models
The model's performance will be compared to baseline models like Support Vector Machines (SVM) and shallow neural
networks. This comparison will highlight the advantages of using CNNs for logo detection, particularly in handling complex
patterns in logo images.
Real-World Testing
Real-world testing will evaluate the model using logos not seen during training. This testing will ensure the model performs
well across different industries, logo types, and challenging scenarios, such as varying resolutions and background distortions.
VI. RESULT ANALYSIS
The results of the model will be analyzed based on its performance metrics, including accuracy, precision, recall, and F1-score.
A detailed comparison will be made between the CNN model and baseline models to evaluate its superiority in detecting fake
logos. The confusion matrix will provide insights into the types of errors made, helping to fine-tune the model. Additionally,
real-world testing will be conducted to assess the model’s robustness in handling different logo variations and online
environments, ensuring it can effectively detect counterfeit logos across diverse scenarios.
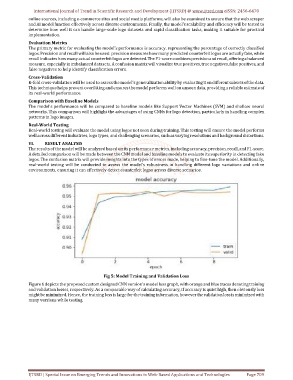
Fig 5: Model Training and Validation Loss
Figure 6 depicts the proposed custom designed CNN version's model loss graph, with orange and blue traces denoting training
and validation losses, respectively. As a comparable way of calculating accuracy, if accuracy is quiet high, then obviously loss
might be minimized. Hence, the training loss is large for the training information, however the validation loss is minimized with
many versions while testing.
IJTSRD | Special Issue on Emerging Trends and Innovations in Web-Based Applications and Technologies Page 709