
Page 98 - Emerging Trends and Innovations in Web-Based Applications and Technologies
P. 98
International Journal of Trend in Scientific Research and Development (IJTSRD) @ www.ijtsrd.com eISSN: 2456-6470
3. User Experience and Satisfaction:
User Satisfaction Rating: Collected from in-app surveys, rating the overall experience, safety perception, driver
professionalism, and convenience. A higher average score indicates a positive user experience.
Net Promoter Score (NPS): Measures user loyalty and the likelihood of recommending the app to others. A higher NPS
score indicates customer satisfaction and retention.
App Usability: Evaluated through metrics such as user onboarding time, ease of ride booking, and navigation intuitiveness.
A streamlined experience is vital for user retention.
Feedback Response Time: The average time taken to resolve user complaints and feedback submitted through the app’s
support system.
4. Scalability and Growth:
User Growth Rate: Measures the number of new users joining the platform over a defined period, showing the app’s
ability to attract and retain customers.
Geographical Coverage: Analyzes the expansion and reach of the service in different areas. The ability to expand the
service to various urban locations is crucial for scalability.
Evaluation Methodology:
The evaluation process involves both quantitative and qualitative approaches:
Quantitative Data Analysis: Collection of app usage statistics (e.g., ride duration, matching time, response times), system
logs, and real-time tracking performance. Statistical analysis will be performed to measure trends and performance
improvements over time.
User Surveys and Interviews: Post-ride surveys and user interviews to collect feedback on the app’s safety features, ease
of use, and overall experience. This will be complemented by user-generated ratings for drivers and services.
A/B Testing: A/B tests will be conducted on different features (e.g., emergency response times or ride matching
algorithms) to determine which configurations lead to better user satisfaction.
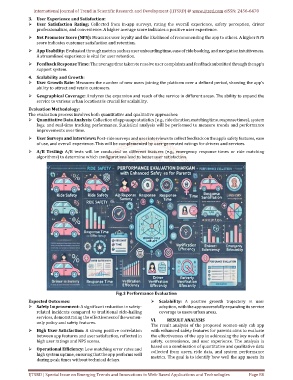
Fig.3 Performance Evaluation
Expected Outcomes: Scalability: A positive growth trajectory in user
Safety Improvement: A significant reduction in safety- adoption, with the app successfully expanding its service
related incidents compared to traditional ride-hailing coverage to more urban areas.
services, demonstrating the effectiveness of the women- VI.
only policy and safety features. RESULT ANALYSIS
The result analysis of the proposed women-only cab app
High User Satisfaction: A strong positive correlation with enhanced safety features for parents aims to evaluate
between app features and user satisfaction, reflected in the effectiveness of the app in addressing the key needs of
high user ratings and NPS scores. safety, convenience, and user experience. The analysis is
based on a combination of quantitative and qualitative data
Operational Efficiency: Low matching error rates and collected from users, ride data, and system performance
high system uptime, ensuring that the app performs well metrics. The goal is to identify how well the app meets its
during peak times without technical delays.
IJTSRD | Special Issue on Emerging Trends and Innovations in Web-Based Applications and Technologies Page 88