
Page 51 - Special Issue Modern Trends in Scientific Research and Development, Case of Asia
P. 51
International Journal of Trend in Scientific Research and Development (IJTSRD) @ www.ijtsrd.com eISSN: 2456-6470
potential barrier height depends on the energy distribution In [4], the measurement was carried out on the same type
width of the defects state density near the Fermi level. As is sample, but at different illumination powers. As can be seen,
known, the defects state density near the Fermi level is with decreasing illumination power, the number of photo
several orders of magnitude lower than the state density in generated holes decreases, when the concentration of photo
the rest of the mobility gap. Therefore, when the incident generated holes goes down below the p=ND boundary, the
light is absorbed at these levels, all the electrons in these quadratic section is not observed. This is also an additional
states pass into the conduction band and due to this, the proof of our assumption.
Fermi level shifts downward. The distribution of these states
obeys the Gaussian law[7]. From the experimental plots obtained in [8], it can be seen
that no other photocurrent dependences on the applied
voltage were observed before the quadratic beginning
section. That is, when voltage is applied, a section begins,
which obeys a quadratic law. This photo-CVC behavior can
Here E0 is the state density peak of the Gaussian distribution; be explained by low value of the defect concentration in the
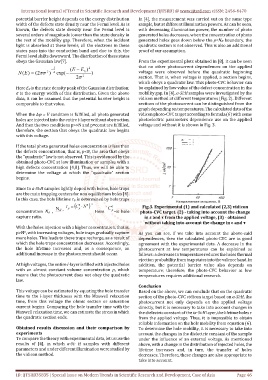
σ is the energy width of this distribution. Given the above mobility gap. In [4], a-Si:H samples were investigated by the
data, it can be assumed that the potential barrier height is vidicon method at different temperatures [Fig. 2]. Different
comparable to that value. sections of the photocurrent can be distinguished from the
graph depending on temperatures. The calculated data of the
When the ∆φ = U condition is fulfilled, all photo generated vidicon photo-CVC target according to formula (6) with some
holes are injected into the entire i-layer without obstruction. photoelectric parameters dependence use on the applied
And then the two conditions p>>N and p=const are fulfilled, voltage and without it is shown in Fig. 3.
therefore, the section that obeys the quadratic law begins
with this voltage.
If the total photo generated holes concentration is less than
the defects concentration, that is, p<N, the area that obeys
the “quadratic” law is not observed. This is evidenced by the
obtained photo-CVC at low illumination or samples with a
high defects concentration [4,8]. Thus, we will be able to
determine the voltage at which the "quadratic" section
begins.
Since in a-Si:H samples lightly doped with boron, hole traps
are the main trapping centers for non equilibrium holes [4].
In this case, the hole lifetime τp is determined by hole traps
Fig.3. Experimental (1) and calculated (2,3) vidicon
concentration Nd , Here is hole photo-CVC target. (2) - taking into account the change
capture ratio. in ε and τ from the applied voltage, (3) - obtained
without taking into account the change in ε and τ
With the holes injection with a higher concentration, that is,
p>N , with increasing voltages, hole traps gradually capture As you can see, if we take into account the above-said
0
more holes. This leads to these traps recharge, as a result of dependences, then the calculated photo-CVC are in good
which the hole traps concentration decreases. Accordingly, agreement with the experimental data. A decrease in the
the hole lifetime increases and, as a consequence, an photocurrent at low temperatures can be explained as
additional increase in the photocurrent should occur. follows: a decrease in temperature reduces the holes thermal
ejection probability from trap states into the valence band. In
At high voltages, the entire i-layer is filled with injected holes addition, the potential barrier value also depends on
with an almost constant volume concentration p, which temperature; therefore, the photo-CVC behavior at low
means that the photocurrent does not obey the quadratic temperatures requires additional research.
law.
Conclusion
This voltage can be estimated by equating the hole transfer Based on the above, we can conclude that on the quadratic
time to the i-layer thickness with the Maxwell relaxation section of the photo-CVC vidicon target based on a-Si:H, the
time, from this voltage the ohmic section or saturation photocurrent not only depends on the applied voltage
current begins. Comparing the hole transfer time with the directly, but it is necessary to take into account changes in
Maxwell relaxation time, we can estimate the stress in which the dielectric constant of the ia-Si:H layer, the lifetime holes τ
the quadratic section ends. from the applied voltage. Thus, it is impossible to obtain
reliable information on the hole mobility from equation (6).
Obtained results discussion and their comparison by To determine the hole mobility, it is necessary to take into
experiments account the changes in the dielectric constant of the sample
To compare the theory with experimental data, let us use the under the influence of an external voltage. As mentioned
results of [4], in which a-Si: H samples with different above, with a change in the distribution of injected holes, the
parameters and under different illumination were studied by lifetime increases and, in turn, the transfer of holes
the vidicon method. decreases. Therefore, these changes are also appropriate to
take into account.
ID: IJTSRD35835 | Special Issue on Modern Trends in Scientific Research and Development, Case of Asia Page 46