
Page 68 - IJTSRD.com - Special Issue - 2nd International Congress of Engineering
P. 68
International Journal of Trend in Scientific Research and Development (IJTSRD) ISSN: 2456Scientific Research and Development (IJTSRD) ISSN: 2456Scientific Research and Development (IJTSRD) ISSN: 2456-6470
nd
Special Issue of Special Issue of 2 International Congress of Engineering
T
The above figure indicates that most of the representative sample of students chose their career because they The above figure indicates that most of the representative sample of students chose their career because they he above figure indicates that most of the representative sample of students chose their career because they
liked it. On the other hand, slightly less than the average student chose liked it. On the other hand, slightly less than the average student chose his career because he did not stay in his career because he did not stay in
another school. And a few students responded that they chose their career because their parents chose the race.another school. And a few students responded that they chose their career because their parents chose the race.nother school. And a few students responded that they chose their career because their parents chose the race.
a
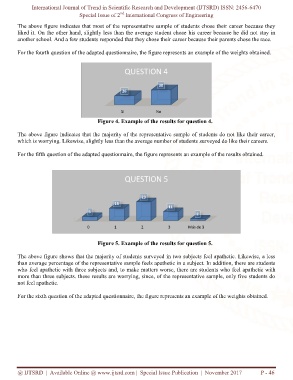
For the fourth question of the adapted questionnaire, the figure represents an example of the weights obtaFor the fourth question of the adapted questionnaire, the figure represents an example of the weights obtaor the fourth question of the adapted questionnaire, the figure represents an example of the weights obtained.
F
QUESTION 4
30
26
Si No
Figure 4Figure 4. Example of the results for question 4.
T
The above figure indicates that the majority of the representative sample of students do not like their career, The above figure indicates that the majority of the representative sample of students do not like their career, he above figure indicates that the majority of the representative sample of students do not like their career,
which is worrying. Likewise, slightly less than the average number of students which is worrying. Likewise, slightly less than the average number of students surveyed do like their careers.surveyed do like their careers.
For the fifth question of the adapted questionnaire, the figure represents an example of the results obtained.For the fifth question of the adapted questionnaire, the figure represents an example of the results obtained.or the fifth question of the adapted questionnaire, the figure represents an example of the results obtained.
F
QUESTION 5
23
15
11
5
2
0 1 2 3 Más de 3
Figure 5Figure 5. Example of the results for question 5.
The above figure shows that the majority of students The above figure shows that the majority of students surveyed in two subjects feel apathetic. Likewise, a less surveyed in two subjects feel apathetic. Likewise, a less
than average percentage of the representative sample feels apathetic in a subject. In addition, there are students than average percentage of the representative sample feels apathetic in a subject. In addition, there are students han average percentage of the representative sample feels apathetic in a subject. In addition, there are students
t
who feel apathetic with three subjects and, to make matters worse, there are studenwho feel apathetic with three subjects and, to make matters worse, there are students who ts who feel apathetic with
more than three subjects. these results are worrying, since, of the representative sample, only five students do more than three subjects. these results are worrying, since, of the representative sample, only five students do ore than three subjects. these results are worrying, since, of the representative sample, only five students do
m
not feel apathetic.
F
For the sixth question of the adapted questionnaire, the figure represents an example of the weiFor the sixth question of the adapted questionnaire, the figure represents an example of the weior the sixth question of the adapted questionnaire, the figure represents an example of the weights obtained.
@ IJTSRD | Available Online @ www.ijtsrd.com@ IJTSRD | Available Online @ www.ijtsrd.com | Special Issue Publication | November 2017 Publication | November 2017 P - 46