
Page 67 - IJTSRD.com - Special Issue - 2nd International Congress of Engineering
P. 67
International Journal of Trend in Scientific Research and Development (IJTSRD) ISSN: 2456Scientific Research and Development (IJTSRD) ISSN: 2456Scientific Research and Development (IJTSRD) ISSN: 2456-6470
nd
Special Issue of Special Issue of 2 International Congress of Engineering
Where:
n: sample size
N: population size
Z
Z: value corresponding to the gauss distribution, for the investigation Z = 95%, which is equal to 1.96.Z: value corresponding to the gauss distribution, for the investigation Z = 95%, which is equal to 1.96.: value corresponding to the gauss distribution, for the investigation Z = 95%, which is equal to 1.96.
p: expected prevalence of the parameter to be evaluated, if not known (p = 0.5), which makes the sample size prevalence of the parameter to be evaluated, if not known (p = 0.5), which makes the sample size prevalence of the parameter to be evaluated, if not known (p = 0.5), which makes the sample size
larger.
q: 1 - p (if p = 70%, q = 30%)
i: error expected to be committed if it is 5%, i = 0.05i: error expected to be committed if it is 5%, i = 0.05.
The development of the formula is as follows:The development of the formula is as follows:
. 1 ( 96 ) 2 * 65 * 5.0* * 5 . 0 62 . 42 62 . 42
n 55. .71 56
. 0 ( 05 ) 2 ( 65 ) 1 1 ( 96.1 ) 2 * 5 . 0 * 5 . 0 . 0 16 . 0 9604 . 1 1204
The study indicated that of a population of 65 The study indicated that of a population of 65 The previous figure shows that the majority of first The previous figure shows that the majority of first
students, using 95% confidence and 5% of error students, using 95% confidence and 5% of error semester students associate apathy with abandonment. semester students associate apathy with abandonment.
T
allowed, the study will require 56 students.allowed, the study will require 56 students. This result may be that if a student is his result may be that if a student is apathetic in his
s
studies, he is likely to drop them.tudies, he is likely to drop them.
F
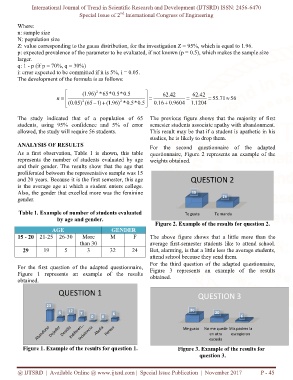
ANALYSIS OF RESULTS For the second questionnaire of the adapted or the second questionnaire of the adapted
As a first observation, Table 1 is shown, this table As a first observation, Table 1 is shown, this table questionnaire, Figure 2 represents an example of the stionnaire, Figure 2 represents an example of the
que
represents the number of students evaluated by age number of students evaluated by age weights obtained.
and their gender. The results show that the age that and their gender. The results show that the age that
proliferated between the representative sample was 15 proliferated between the representative sample was 15
QUESTION 2UESTION 2
and 20 years. Because it is the first semester, this age and 20 years. Because it is the first semester, this age Q
is the average age at which a student enters college. is the average age at which a student enters college.
Also, the gender that excelled more was the feminine so, the gender that excelled more was the feminine 30
gender. 26
Table 1. Example of number of students evaluated Table 1. Example of number of students evaluated Te gusta T
Te mandae manda
by age and gender.
Figure 2. Example of the results for question 2le of the results for question 2.
AGE GENDER
The above figure shows that a little he above figure shows that a little more than the
15 - 20 21-25 26-30 More M F T
than 30 average first-semester students like to attend school. semester students like to attend school.
29 19 5 3 32 24 But, alarming, is that a little less the average students, ut, alarming, is that a little less the average students,
B
a
attend school because they send them.ttend school because they send them.
F
For the third question of the adapted questionnaire, or the third question of the adapted questionnaire,
For the first question of the adapted questionnaire, For the first question of the adapted questionnaire, F
Figure 3 represents an example of theigure 3 represents an example of the results
Figure 1 represents an example of the results 1 represents an example of the results
obtained. obtained.
QUESTION 1 Q
QUESTION 3UESTION 3
23
8 12 7 6 30 2 200
0 0 6
N
Me gusto No me quede o me quede Mis padres la
e en otra n otra escogieron
escuelascuela
e
Figure 1. Example of the results for question 1.Figure 1. Example of the results for question 1. Figure 3. Example of the results for le of the results for
q
question 3uestion 3.
@ IJTSRD | Available Online @ www.ijtsrd.com@ IJTSRD | Available Online @ www.ijtsrd.com | Special Issue Publication | November 2017 Publication | November 2017 P - 45