
Page 70 - IJTSRD.com - Special Issue - 2nd International Congress of Engineering
P. 70
International Journal of Trend in Scientific Research and Development (IJTSRD) ISSN: 2456Scientific Research and Development (IJTSRD) ISSN: 2456Scientific Research and Development (IJTSRD) ISSN: 2456-6470
nd
Special Issue of Special Issue of 2 International Congress of Engineering
QUESTION 8
24
22
5 5
0 0
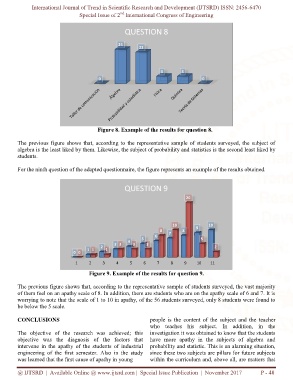
Figure 8Figure 8. Example of the results for question 8.
The previous figure shows that, according to the representative sample of students surveyed, the subject of The previous figure shows that, according to the representative sample of students surveyed, the subject of he previous figure shows that, according to the representative sample of students surveyed, the subject of
T
algebra is the least liked by them. Likewise, the subject of probability andalgebra is the least liked by them. Likewise, the subject of probability and statistics is the second least liked by statistics is the second least liked by
students.
For the ninth question of the adapted questionnaire, the figure represents an example of the results obtained.For the ninth question of the adapted questionnaire, the figure represents an example of the results obtained.or the ninth question of the adapted questionnaire, the figure represents an example of the results obtained.
F
QUESTION 9
20
10 10
8 8 9
6 7
5 5
4
3 3 3 3
2 2
1 1 1
0 0
1 2 3 4 5 6 7 8 9 10 11
Figure 9Figure 9. Example of the results for question 9.
The previous figure shows that, according The previous figure shows that, according to the representative sample of students surveyed, the vast majority to the representative sample of students surveyed, the vast majority
of them feel on an apathy scale of 8. In addition, there are students who are on the apathy scale of 6 and 7. It is of them feel on an apathy scale of 8. In addition, there are students who are on the apathy scale of 6 and 7. It is them feel on an apathy scale of 8. In addition, there are students who are on the apathy scale of 6 and 7. It is
of
worrying to note that the scale of 1 to 10 in apathy, of the 56 studentworrying to note that the scale of 1 to 10 in apathy, of the 56 students surveyed, only 8 students were found to s surveyed, only 8 students were found to
be below the 5 scale.
pe
CONCLUSIONS people is the content of the subject and thople is the content of the subject and the teacher
who teaches his subject. In addition, in the ho teaches his subject. In addition, in the
w
The objective of the research was achieved;achieved; this investigation it was obtained to know that the students investigation it was obtained to know that the students
objective was the diagnosis of the factors that objective was the diagnosis of the factors that have more apathy in the subjects of algebra and have more apathy in the subjects of algebra and
intervene in the apathy of the students of industrial intervene in the apathy of the students of industrial probability and statistic. This is an alarming situation, probability and statistic. This is an alarming situation,
engineering of the first semester. Also in the study engineering of the first semester. Also in the study since these two subjects are pillars fosince these two subjects are pillars for future subjects
was learned that the first cause of apathy in young was learned that the first cause of apathy in young w
within the curriculum and, above all, are matters that ithin the curriculum and, above all, are matters that
@ IJTSRD | Available Online @ www.ijtsrd.com@ IJTSRD | Available Online @ www.ijtsrd.com | Special Issue Publication | November 2017 Publication | November 2017 P - 48