
Page 44 - IJTSRD.com - Special Issue - 2nd International Congress of Engineering
P. 44
I International Journal of Trend in Scientific Research and Development (IJTSRD) ISSN: 2456International Journal of Trend in Scientific Research and Development (IJTSRD) ISSN: 2456nternational Journal of Trend in Scientific Research and Development (IJTSRD) ISSN: 2456-6470
nd
Special Issue of Special Issue of 2 International Congress of Engineering
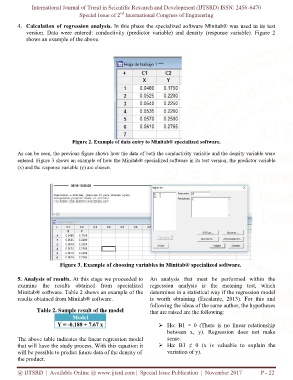
4. Calculation of regression analysis.Calculation of regression analysis. In this phase the specialized software Minitab® was used in its test In this phase the specialized software Minitab® was used in its test
version. Data were entered: conduversion. Data were entered: conductivity (predictor variable) and density (response variable). Figure 2 ctivity (predictor variable) and density (response variable). Figure 2
shows an example of the above.
Figure 2. Example of data entry to Minitab® speFigure 2. Example of data entry to Minitab® specialized software.cialized software.
As can be seen, the previous figure shows how the data of both the conductivity variable and the density variable were As can be seen, the previous figure shows how the data of both the conductivity variable and the density variable were s can be seen, the previous figure shows how the data of both the conductivity variable and the density variable were
A
e
entered. Figure 3 shows an example of how the Minitab® specialized software in its test version, the predictor variabentered. Figure 3 shows an example of how the Minitab® specialized software in its test version, the predictor variabntered. Figure 3 shows an example of how the Minitab® specialized software in its test version, the predictor variable
(x) and the response variable (y) are chosen.(x) and the response variable (y) are chosen.
F
Figure 3. Example of choosing variables in Minitab® specialized software.Figure 3. Example of choosing variables in Minitab® specialized software.igure 3. Example of choosing variables in Minitab® specialized software.
5. Analysis of results. At this stage we proceeded to At this stage we proceeded to An analysis that must be performed within the An analysis that must be performed within the
examine the results obtained from specialized examine the results obtained from specialized regression analysis is the meaning test, which regression analysis is the meaning test, which
Minitab® software. Table 2 shows an example of the Minitab® software. Table 2 shows an example of the determines in a statistical way if the regression model ermines in a statistical way if the regression model
results obtained from Minitab® software.results obtained from Minitab® software. is worth obtaining (Escalante, 2013). For this and s worth obtaining (Escalante, 2013). For this and
i
f following the ideas of the same author, the hypotheses ollowing the ideas of the same author, the hypotheses
Table 2. Sample result of the modele 2. Sample result of the model that are raised are the following:hat are raised are the following:
t
Model
Y = -0.188 + 7.67 x Ho: B1 = 0 (There is no linear relationship Ho: B1 = 0 (There is no linear relationship
between x, y). Regression does not make gression does not make
The above table indicates the linear regression model tes the linear regression model sense.
that will have the study process. With this equation it that will have the study process. With this equation it Ha: B1 ≠ 0 (x is valuable t≠ 0 (x is valuable to explain the
will be possible to predict future data of the density of will be possible to predict future data of the density of variation of y).
the product.
@ IJTSRD | Available Online @ www.ijtsrd.com@ IJTSRD | Available Online @ www.ijtsrd.com | Special Issue Publication | NovemberNovember 2017 P - 22