
Page 45 - IJTSRD.com - Special Issue - 2nd International Congress of Engineering
P. 45
International Journal of Trend in Scientific Research and Development (IJTSRD) ISSN: 2456-6470
nd
Special Issue of 2 International Congress of Engineering
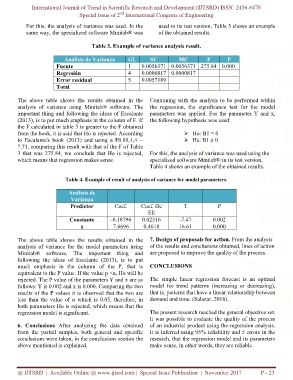
For this, the analysis of variance was used. In the used in its test version, Table 3 shows an example
same way, the specialized software Minitab® was of the obtained results.
Table 3. Example of variance analysis result.
Análisis de Varianza GL SC MC F P
Fuente 1 0.0056371 0.0056371 275.84 0.000
Regresión 4 0.0000817 0.0000817
Error residual 5 0.0057189
Total
The above table shows the results obtained in the Continuing with the analysis to be performed within
analysis of variance using Minitab® software. The the regression, the significance test for the model
important thing and following the ideas of Escalante parameters was applied. For the parameter Y and x,
(2013), is to put much emphasis in the column of F. If the following hypothesis was used:
the F calculated in table 3 is greater to the F obtained
from the book, it is said that Ho is rejected. According Ho: B1 = 0
to Escalante's book (2013) and using a F0.05,1,4 = Ha: B1 ≠ 0
7.71, comparing this result with that of the F of Table
3 that was 275.84, we conclude that Ho is rejected, For this, the analysis of variance was used using the
which means that regression makes sense. specialized software Minitab® in its test version,
Table 4 shows an example of the obtained results.
Table 4. Example of result of analysis of variance for model parameters.
Análisis de
Varianza
Predictor Coef. Coef. De T P
EE
Constante -0.18796 0.02516 -7.47 0.002
x 7.6696 0.4618 16.61 0.000
The above table shows the results obtained in the 7. Design of proposals for action. From the analysis
analysis of variance for the model parameters using of the results and conclusions obtained, lines of action
Minitab® software. The important thing and are proposed to improve the quality of the process.
following the ideas of Escalante (2013), is to put
much emphasis in the column of the P, that is CONCLUSIONS
equivalent to the P value. If the value p <α, Ho will be
rejected. The P value of the parameters Y and x are as The simple linear regression forecast is an optimal
follows: Y is 0.002 and x is 0.000. Comparing the two model for trend patterns (increasing or decreasing),
results of the P values it is observed that the two are that is, patterns that have a linear relationship between
less than the value of α which is 0.05, therefore, in demand and time. (Salazar, 2016).
both parameters Ho is rejected, which means that the
regression model is significant. The present research reached the general objective set.
It was possible to evaluate the quality of the process
6. Conclusions After analyzing the data obtained of an industrial product using the regression analysis.
from the partial samples, both general and specific It is inferred using 95% reliability and 5 errors in the
conclusions were taken, in the conclusions section the research, that the regression model and its parameters
above mentioned is explained. make sense, in other words, they are reliable.
@ IJTSRD | Available Online @ www.ijtsrd.com | Special Issue Publication | November 2017 P - 23