
Page 58 - IJTSRD.com - Special Issue - 2nd International Congress of Engineering
P. 58
International Journal of Trend in Scientific Research and Development (IJTSRD) ISSN: 2456-6470
nd
Special Issue of 2 International Congress of Engineering
In order to provide quality services, it is necessary to improvement and to be able to offer the users a truly
develop the people (Human talent) who are providing quality service. It is for all of the above, that it
the service, however, it is extremely important to find becomes necessary to have an analysis that allows us
a way to evaluate the perception of quality in the to determine our areas of opportunity and to be able to
service that users of the same have. In this way we improve them to achieve an optimal development of
can train and develop human talent to provide a human talent, which in turn will derive in the
quality service and have satisfied customers, which economic development of the organization, which
will determine the increase of them. will impact on the development of the country.
It is necessary then to know what the expectations of Method Description
our users are and compare them with their perceptions
of the service received to determine the level of The study was carried out in 7 stages as shown in
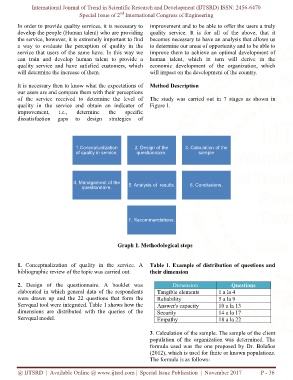
quality in the service and obtain an indicator of Figure 1.
improvement, i.e., determine the specific
dissatisfaction gaps to design strategies of
1.Conceptualization 2. Design of the 3. Calculation of the
of quality in service. questionnaire. sample
4. Management of the 5. Analysis of results. 6. Conclusions.
questionnaire.
7. Recommendations.
Graph 1. Methodological steps
1. Conceptualization of quality in the service. A Table 1. Example of distribution of questions and
bibliographic review of the topic was carried out. their dimension
2. Design of the questionnaire. A booklet was Dimension Questions
elaborated in which general data of the respondents Tangible elements 1 a la 4
were drawn up and the 22 questions that form the Reliability 5 a la 9
Servqual tool were integrated. Table 1 shows how the Answer's capacity 10 a la 13
dimensions are distributed with the queries of the Security 14 a la 17
Servqual model. Empathy 18 a la 22
3. Calculation of the sample. The sample of the client
population of the organization was determined. The
formula used was the one proposed by Dr. Bolaños
(2012), which is used for finite or known populations.
The formula is as follows:
@ IJTSRD | Available Online @ www.ijtsrd.com | Special Issue Publication | November 2017 P - 36