
Page 212 - Emerging Trends and Innovations in Web-Based Applications and Technologies
P. 212
International Journal of Trend in Scientific Research and Development (IJTSRD) @ www.ijtsrd.com eISSN: 2456-6470
D. Prediction and Optimization:
Forecasting vaccination demand trends.
Suggesting optimal appointment schedules.
E. Evaluation and Validation:
Measuring model accuracy using performance metrics like MAE, RMSE.
Validating predictions with real-world data.
4. Expected Outcomes
Improved vaccination scheduling efficiency.
Reduced missed appointments through demand forecasting.
Optimized vaccine inventory management.
Enhanced data-driven decision-making for healthcare providers.
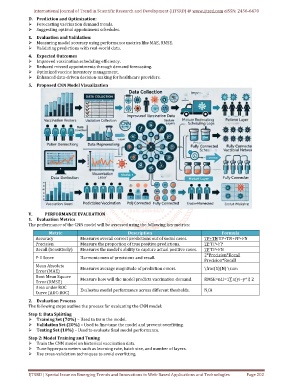
5. Proposed CNN Model Visualization
V. PERFORMANCE EVALUATION
1. Evaluation Metrics
The performance of the CNN model will be assessed using the following key metrics:
Metric Description Formula
Accuracy Measures overall correct predictions out of social cases. TP+TN TP+TN+FP+FN
Precision Measure the proportion of true positive predictions. TP TP+FP
Recall (Sensitively) Measures the model’s ability to capture actual positive cases. TP TP+FN
2*Precision*Recall
F-1 Score Harmonic men of precisions and recall.
Precision*Recall
Mean Absolute
Error (MAE) Measures average magnitude of prediction errors. \frac{1}{N} \sum
Root Mean Square
Measure how will the model predicts vaccination demand. RMSE=n1i=1∑n(yi−y^i) 2
Error (RMSE)
Area under ROC
Curve (AUC-ROC) Evaluates model performance across different thesholds. N/A
2. Evaluation Process
The following steps outline the process for evaluating the CNN model:
Step 1: Data Splitting
Training Set (70%) – Used to train the model.
Validation Set (20%) – Used to fine-tune the model and prevent overfitting.
Testing Set (10%) – Used to evaluate final model performance.
Step 2: Model Training and Tuning
Train the CNN model on historical vaccination data.
Tune hyperparameters such as learning rate, batch size, and number of layers.
Use cross-validation techniques to avoid overfitting.
IJTSRD | Special Issue on Emerging Trends and Innovations in Web-Based Applications and Technologies Page 202