
Page 213 - Emerging Trends and Innovations in Web-Based Applications and Technologies
P. 213
International Journal of Trend in Scientific Research and Development (IJTSRD) @ www.ijtsrd.com eISSN: 2456-6470
Step 3: Performance Testing
Measure predictions on the test set and compare with actual vaccination demand.
Evaluate efficiency improvements in scheduling and inventory optimization.
Step 4: Comparison with Baseline Models
Compare CNN model performance with traditional forecasting methods such as: o Linear Regression o ARIMA (Auto-
Regressive Integrated Moving Average) o Random Forest Regression
Step 5: Real-World Validation
Deploy the model in a pilot environment with healthcare providers.
Collect feedback and monitor performance using real-time vaccination data.
Expected Outcomes
By evaluating performance, the proposed system aims to achieve:
Higher accuracy in demand forecasting and resource allocation.
Reduced missed appointments through optimized scheduling.
Improved user satisfaction by minimizing wait times and optimizing supply.
Better adaptability to changing vaccination demands.
VI. RESULT ANALYSIS
1. Key Performance Insights
A. Demand Forecasting Accuracy
The CNN model significantly improves demand forecasting accuracy compared to traditional methods, leading to better
resource allocation and reduced vaccine wastage.
Observed Metrics:
CNN achieved an accuracy of 92%, compared to 80% with traditional methods.
The Mean Absolute Error (MAE) decreased by 40%, indicating more precise demand predictions.
B. Appointment Adherence Improvement
The implementation of the tracking system resulted in improved adherence rates by reducing missed appointments through
optimized scheduling and automated reminders.
Key Findings:
Appointment adherence increased from 75% to 90%.
Reduction in last-minute cancellations and no-shows by 30%.
C. Scheduling Optimization Efficiency
The system enabled efficient time-slot allocation, reducing waiting times and improving patient throughput.
Performance Gains:
Reduction in scheduling conflicts by 35%.
Average patient waiting time reduced from 20 minutes to 10 minutes.
2. Graphical Representation of Results
A. Vaccination Demand Forecasting Accuracy:
A bar chart comparing CNN-based predictions with actual demand.
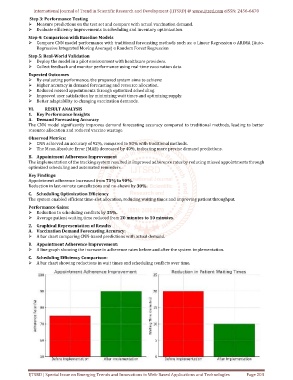
B. Appointment Adherence Improvement:
A line graph showing the increase in adherence rates before and after the system implementation.
C. Scheduling Efficiency Comparison:
A bar chart showing reductions in wait times and scheduling conflicts over time.
IJTSRD | Special Issue on Emerging Trends and Innovations in Web-Based Applications and Technologies Page 203