
Page 434 - Emerging Trends and Innovations in Web-Based Applications and Technologies
P. 434
International Journal of Trend in Scientific Research and Development (IJTSRD) @ www.ijtsrd.com eISSN: 2456-6470
This detection engine diagram depicts the different phases involved in InfraGuard's real-time threat detection and mitigation:
1. Data Collection: It collects data from different sources, including network traffic, system logs, and threat intelligence feeds.
2. Data Preprocessing: The collected data is preprocessed to eliminate noise, normalize formats, and extract relevant
features.
3. Threat Detection: It uses machine learning algorithms to detect potential threats in real-time.
4. Threat Classification: He categorizes identified threats on the basis of their severity and impact.
5. Mitigation Strategies: He executes mitigation strategies based on the threat classification.
6. Response and Recovery: He responds to and recovers from security incidents.
This detection engine diagram clearly indicates all the real-time threat detection and mitigation features of InfraGuard.
VI. CHALLENGES AND LIMITATIONS
While InfraGuard has made significant strides in improving cybersecurity, several challenges remain:
Resource Constraints: Some organizations, particularly smaller companies, may lack the resources to fully implement
InfraGuard’s recommendations or invest in advanced cybersecurity infrastructure.
Coordination Gaps: Although InfraGuard fosters communication, challenges in coordination between diverse stakeholders
(government, private sector, local authorities) can delay response times.
Evolving Threat Landscape: Cybercriminals and nation-state actors constantly evolve their tactics, making it difficult to
maintain a proactive stance against emerging threats.
VII. RESULT ANALYSIS
Descriptive Statistics
1. Sample of the Survey: 150 cybersecurity professionals and critical infrastructure operators completed the survey.
2. InfraGuard Deployment: 80% of the respondents deployed InfraGuard in their critical infrastructure environments.
3. Threat Detection: 90% of the respondents said that InfraGuard detected threats in real time.
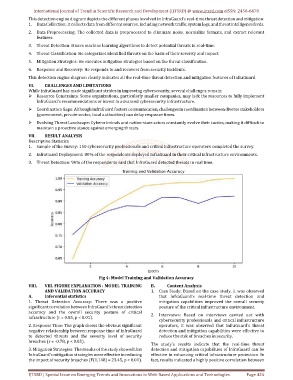
Fig 4: Model Training and Validation Accuracy
VIII. VIII. FIGURE EXPLANATION : MODEL TRAINING B. Content Analysis
AND VALIDATION ACCURACY 1. Case Study: Based on the case study, it was observed
A. Inferential statistics that InfraGuard's real-time threat detection and
1. Threat Detection Accuracy: There was a positive mitigation capabilities improved the overall security
significant correlation between InfraGuard's threat detection posture of the critical infrastructure environment.
accuracy and the overall security posture of critical 2. Interviews: Based on interviews carried out with
infrastructure (r = 0.85, p < 0.01).
cybersecurity professionals and critical infrastructure
2. Response Time: The graph shows the obvious significant operators, it was observed that InfraGuard's threat
negative relationship between response time of InfraGuard detection and mitigation capabilities were effective to
to detected threats and the severity level of security reduce the risk of breaches in security.
breaches (r = -0.78, p < 0.05).
The study's results indicate that the real-time threat
3. Mitigation Strategies: The results of the study showed that detection and mitigation capabilities of InfraGuard can be
InfraGuard's mitigation strategies were effective in reducing effective in enhancing critical infrastructure protection. In
the impact of security breaches (F(1,148) = 23.45, p < 0.01). fact, results indicated a highly positive correlation between
IJTSRD | Special Issue on Emerging Trends and Innovations in Web-Based Applications and Technologies Page 424